Phpstorm Xdebug 远程调试代码
由于代码审计的需要,部分系统是直接部署的服务器镜像,已经配置好的完整的环境。这时单独把源码拉取到本地再配置环境就过于复杂,直接对服务端的代码进行远程调试就会方便不少。
目前最新版的Phpstorm(2022.1.4),当前的jetbrains的大部分IDE都已经支持ssh连接服务器进行远程开发,不用再像以前一样使用sftp来同步代码。现在IDE可以实现自动实时同步,真正意义上的远程开发。因此和以往网上的配置教程略有些不同。
实验环境
- 本地系统 macos
- 服务端系统 Centos7
- Phpstorm / Xdebug
Remote Development ssh连接远程服务器
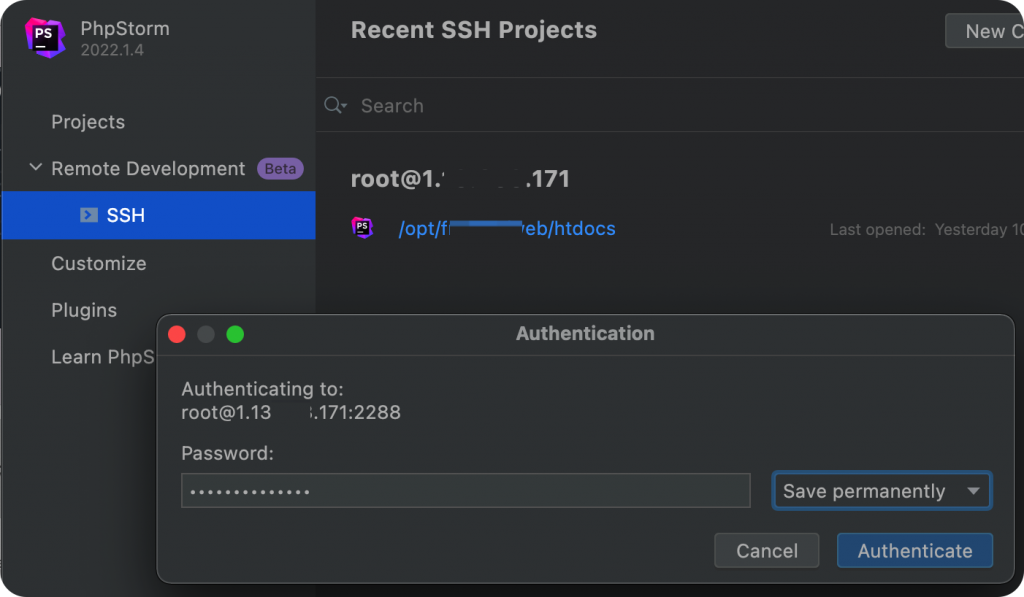
安装最新的Phpstorm,选择Remote Development,填写ssh连接信息。第一次连接会在服务端安装ide的程序。然后选择服务端程序部署的目录,此时就可以远程写代码了,ide会自动同步。
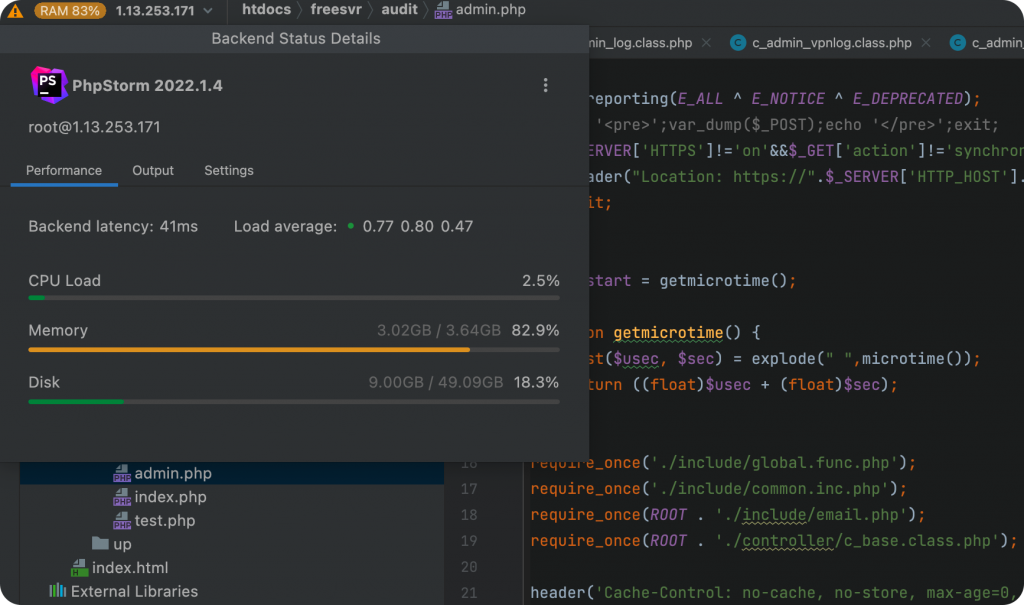
进行主界面后在左上角会显示当前的server段的负载信息,远程开发会比较占用服务端的资源,建议server端最小使用2核4G的机器。
服务端安装xdebug
确定当前php版本
本次目的是为了审计系统镜像中的php代码。先确定系统运行的php版本和安装位置。
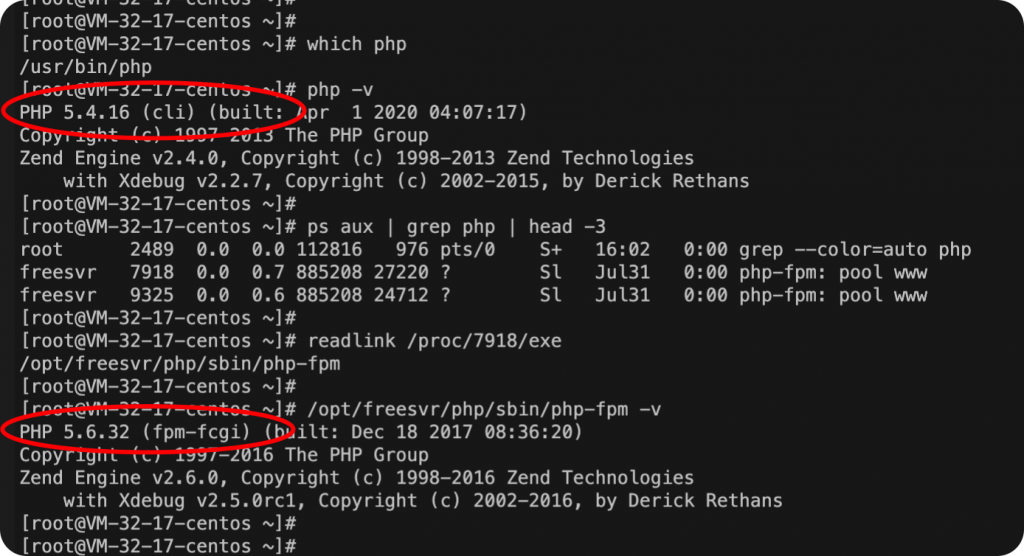
比如我这里当前系统镜像的php和实际运行的php并非同一个版本。正在运行的php并未添加到系统环境变量中。
下载安装php对应的xdebug版本
xdebug官网下载地址:
https://xdebug.org/download/historical
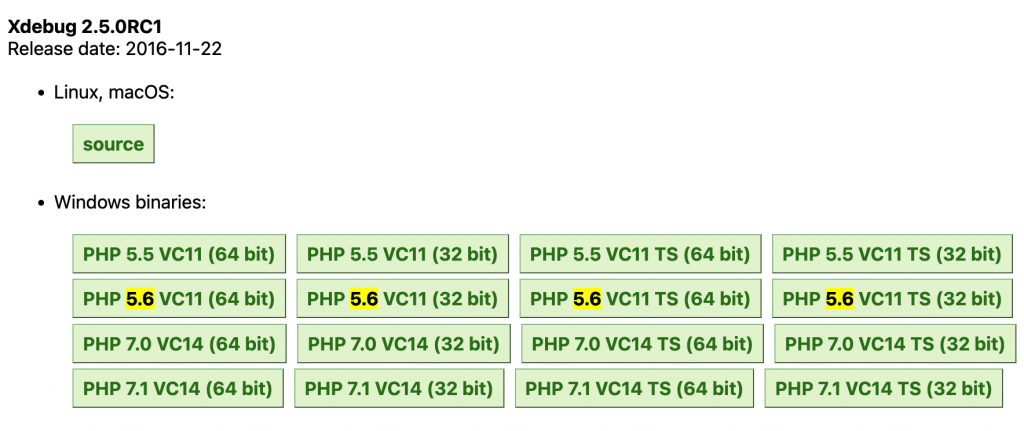
当前服务端的php的版本为5.6.32,在官网下载2.5.0RC1的版本。如果php和xdebug的版本对不上,可以多下载几个试一下。
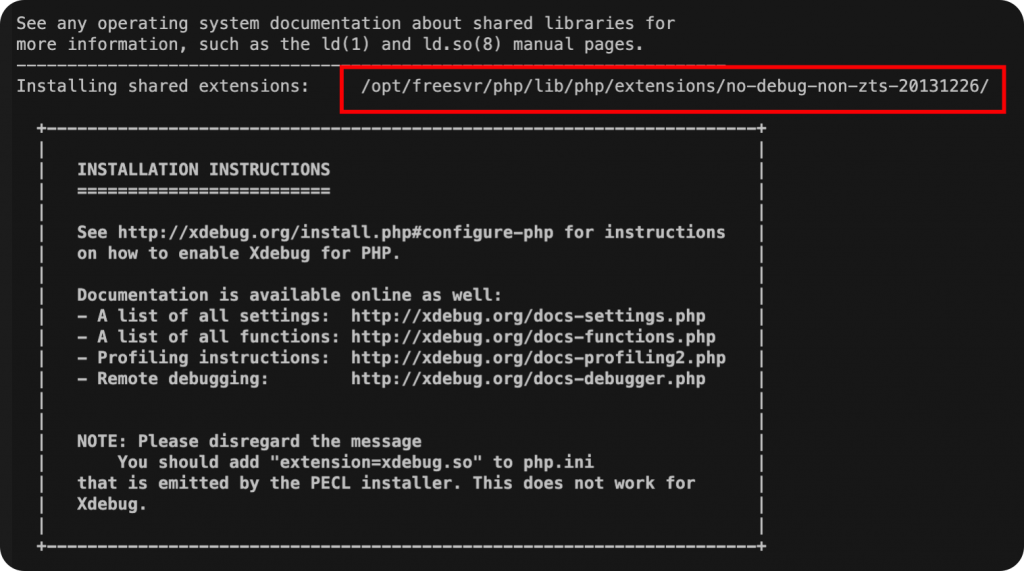
wget https://xdebug.org/files/xdebug-2.5.0rc1.tgz --no-check-certificate
tar xvf xdebug-2.5.0rc1.tgz
cd xdebug-2.5.0RC1/
/opt/freesvr/php/bin/phpize      # 执行你对应的phpize
./configure --with-php-config=/opt/freesvr/php/bin/php-config
make && make install
安装完成后会出现以下界面,xdebug.so的文件路径就在这里。
修改php.ini并重启php-fpm
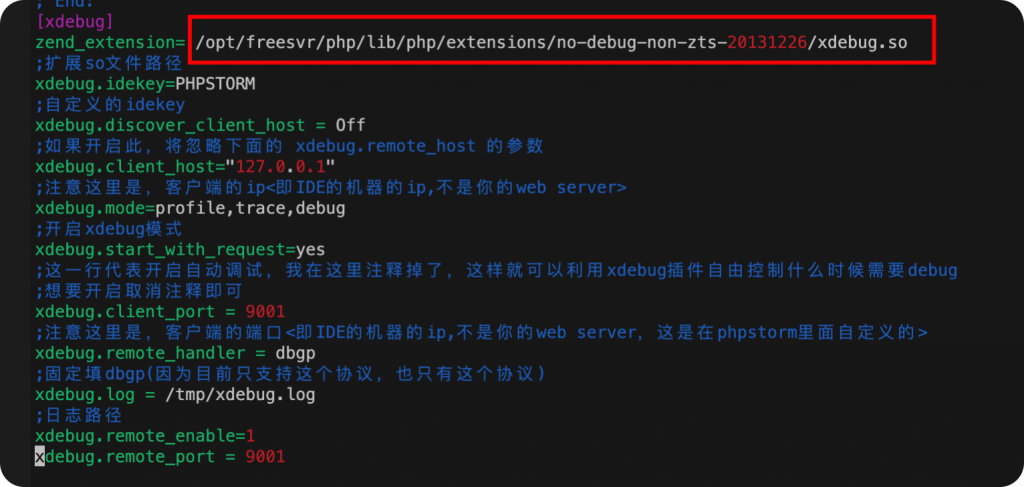
修改php.ini配置文件,添加如下xdebug配置信息。
[xdebug]
zend_extension= /opt/freesvr/php/lib/php/extensions/no-debug-non-zts-20131226/xdebug.so
;扩展so文件路径
xdebug.idekey=PHPSTORM
;自定义的idekey
xdebug.discover_client_host = Off
;如果开启此,将忽略下面的 xdebug.remote_host 的参数
xdebug.client_host="127.0.0.1"
;注意这里是,客户端的ip<即IDE的机器的ip,不是你的web server>
xdebug.mode=profile,trace,debug
;开启xdebug模式
xdebug.start_with_request=yes
xdebug.client_port = 9001
;注意这里是,客户端的端口<即IDE的机器的ip,不是你的web server,这是在phpstorm里面自定义的>
xdebug.remote_handler = dbgp
;固定填dbgp(因为目前只支持这个协议,也只有这个协议)
xdebug.log = /tmp/xdebug.log
;日志路径
xdebug.remote_enable=1
xdebug.remote_port = 9001
指定9001端口是为了不和php-fpm默认的9000端口冲突。
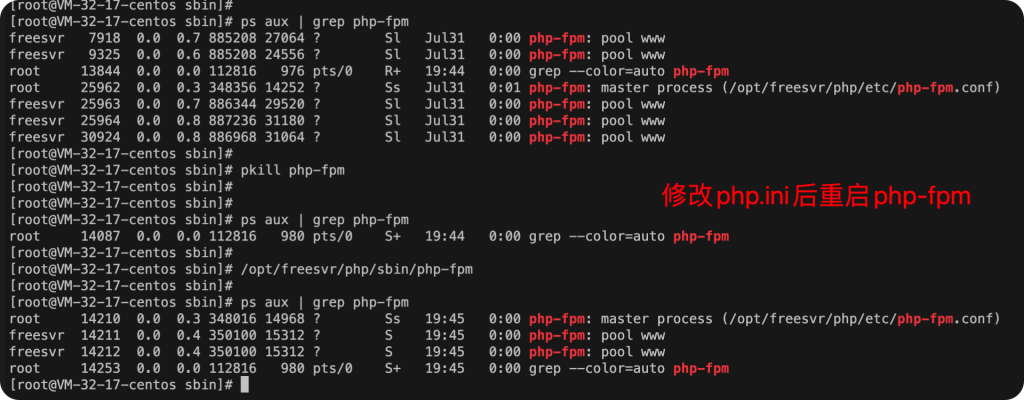
ps aux | grep php-fpm
pkill php-fpm
/opt/freesvr/php/sbin/php-fpm
php 5.3.3 以后的php-fpm 不再支持 php-fpm 以前的 (start|stop|reload)等命令,所以直接pkill再重启。
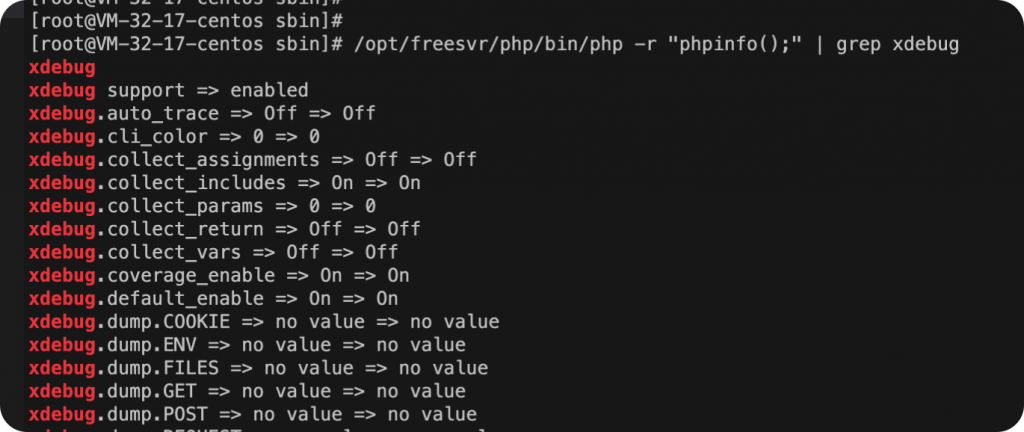
/opt/freesvr/php/bin/php -r "phpinfo();" | grep xdebug
也可以网页打开phpinfo页面。
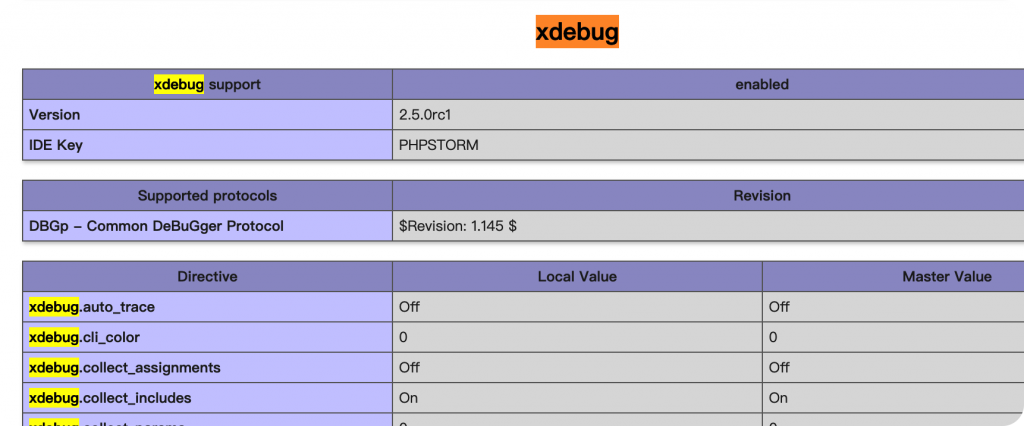
重启后查看phpinfo()如果有xdebug信息就表明xdebug开启成功了。
Phpstorm客户端配置
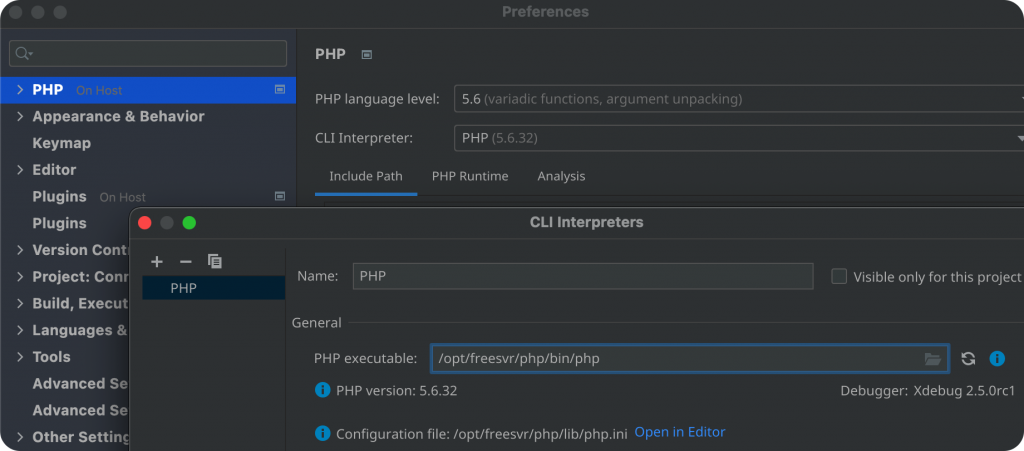
指定php解释器路径
在设置中选择server端的php路径。
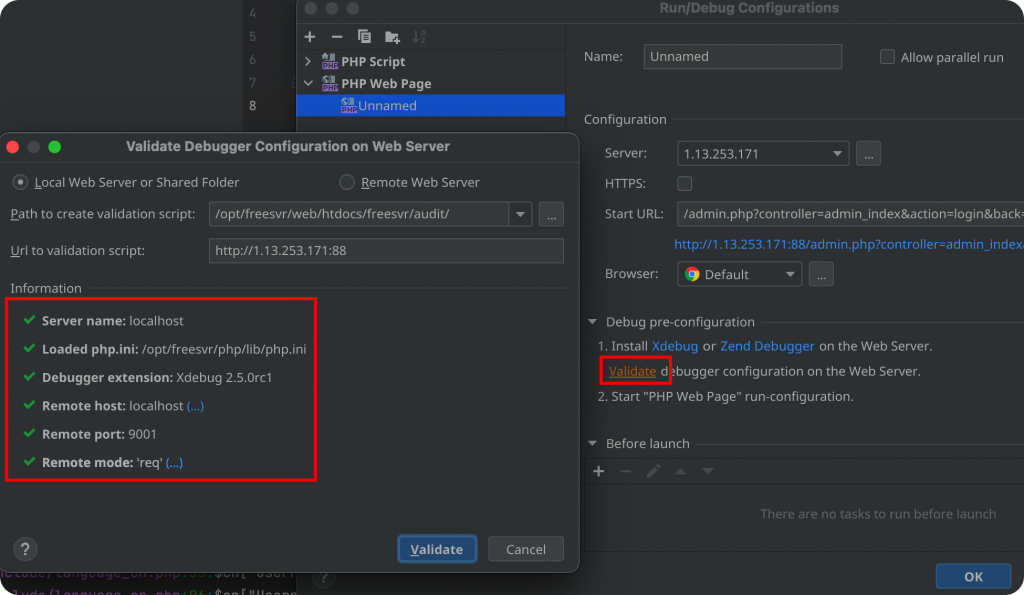
配置xdebug
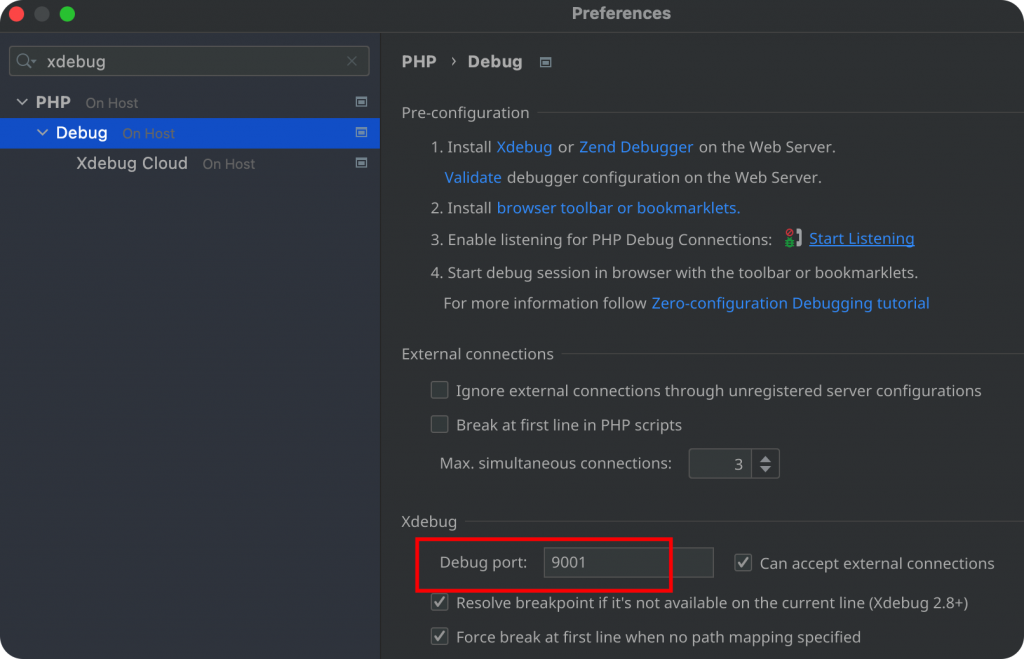
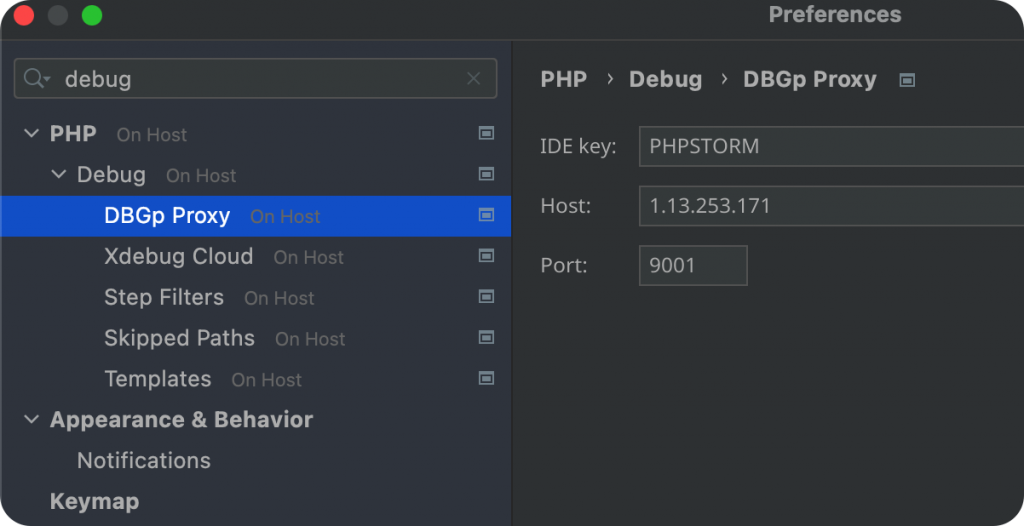
与上面php.ini中xdebug的端口一致即可。然后配置配置DBGp Proxy。
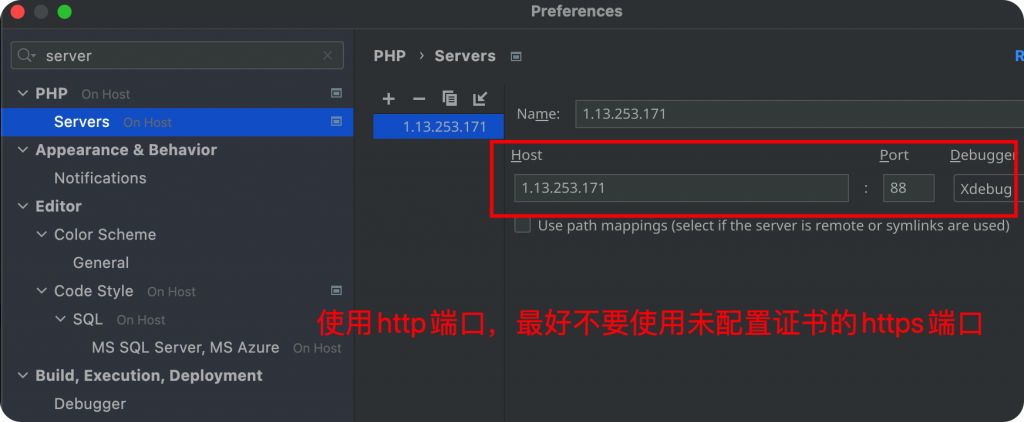
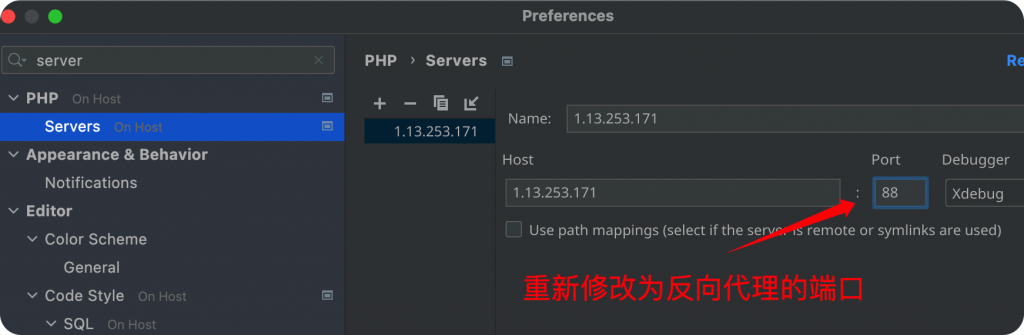
配置Server端Web端口
踩坑记录
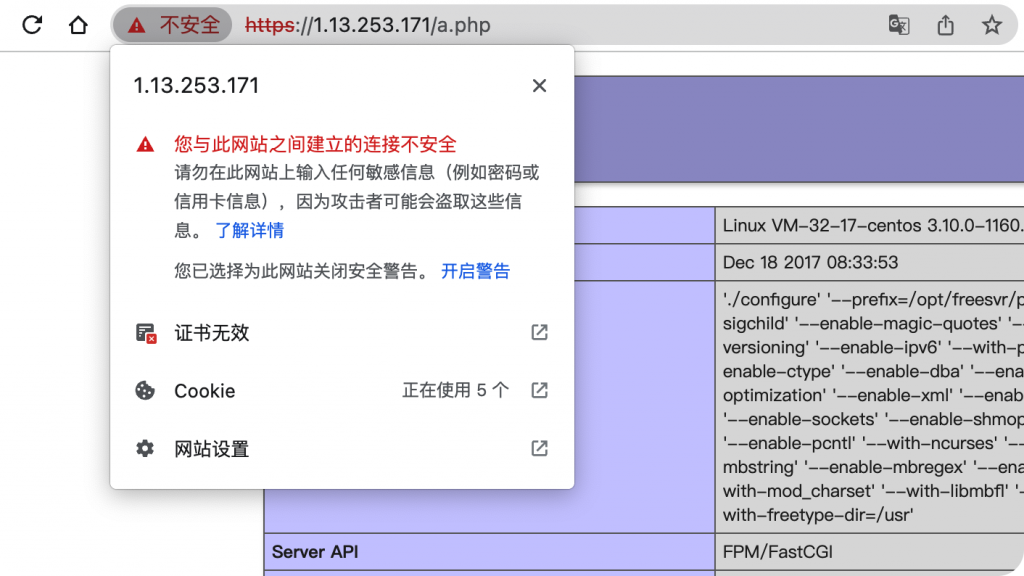
由于使用打包好系统镜像,该网站默认使用的是443端口,但是证书是过期的。这就导致直接访问会报错。
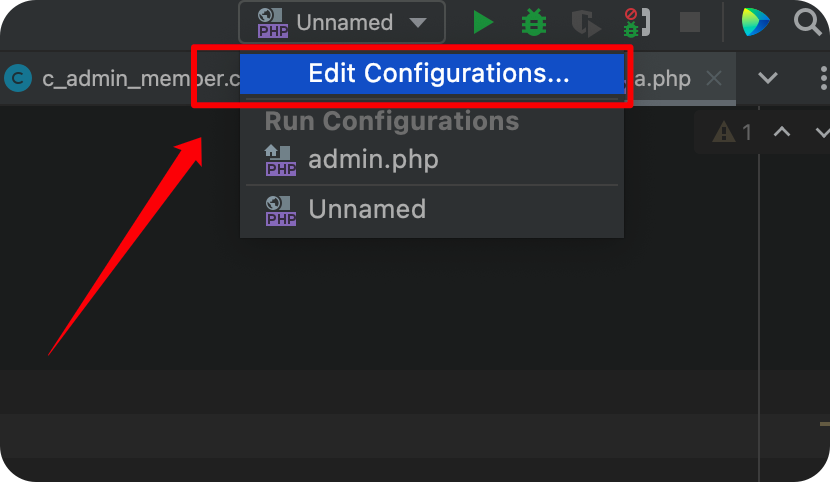
选择右上角的编辑。
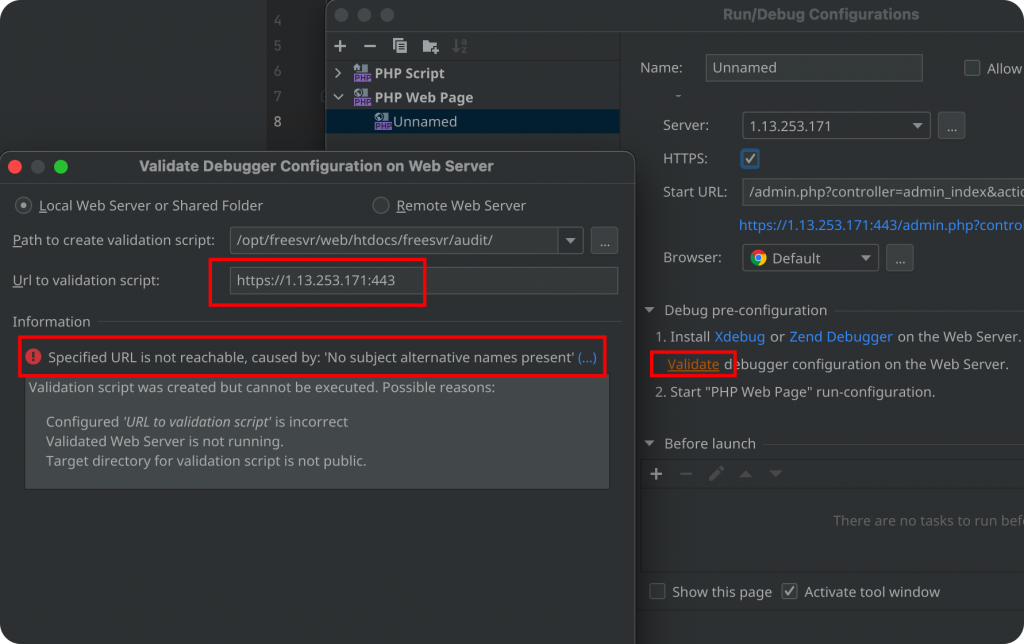
PhpStorm报错提示:specified url is not reachable,no subject alternative names present。
就是因为https证书失效导致的,在这里卡了很长时间。
后来想到一个曲线救国的思路,既然镜像默认配置Nginx的443端口访问,那么我在服务器上再配置一层本地反向代理转发就可以解决。
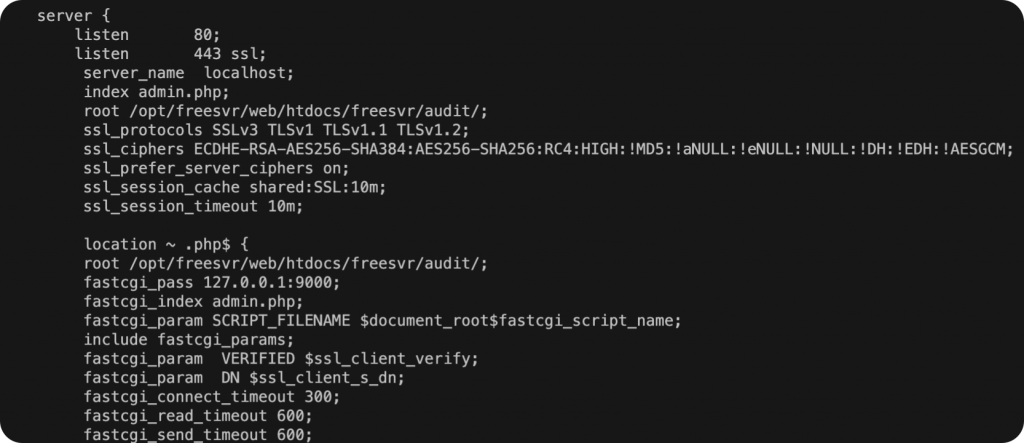
        server {
                listen 88;
                location / {
                proxy_pass https://127.0.0.1:443;
                proxy_ssl_verify off;
        }
添加一层反向代理,解决ssl证书错误的问题。
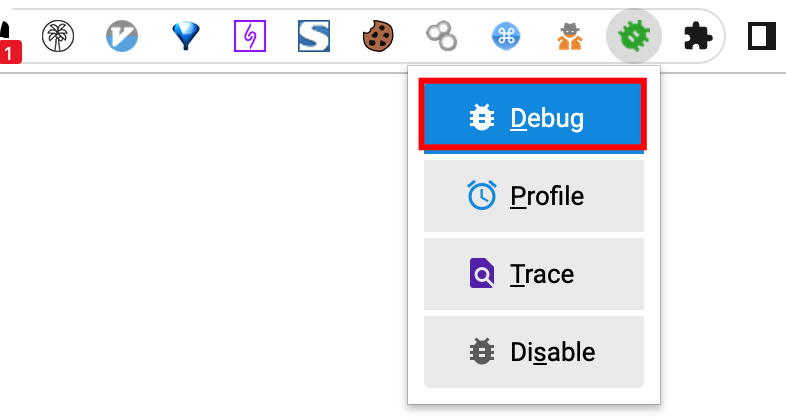
安装Xdebug helper浏览器插件
https://chrome.google.com/webstore/detail/xdebug-helper/eadndfjplgieldjbigjakmdgkmoaaaoc

安装完成后再插件配置页面选择phpstorm。
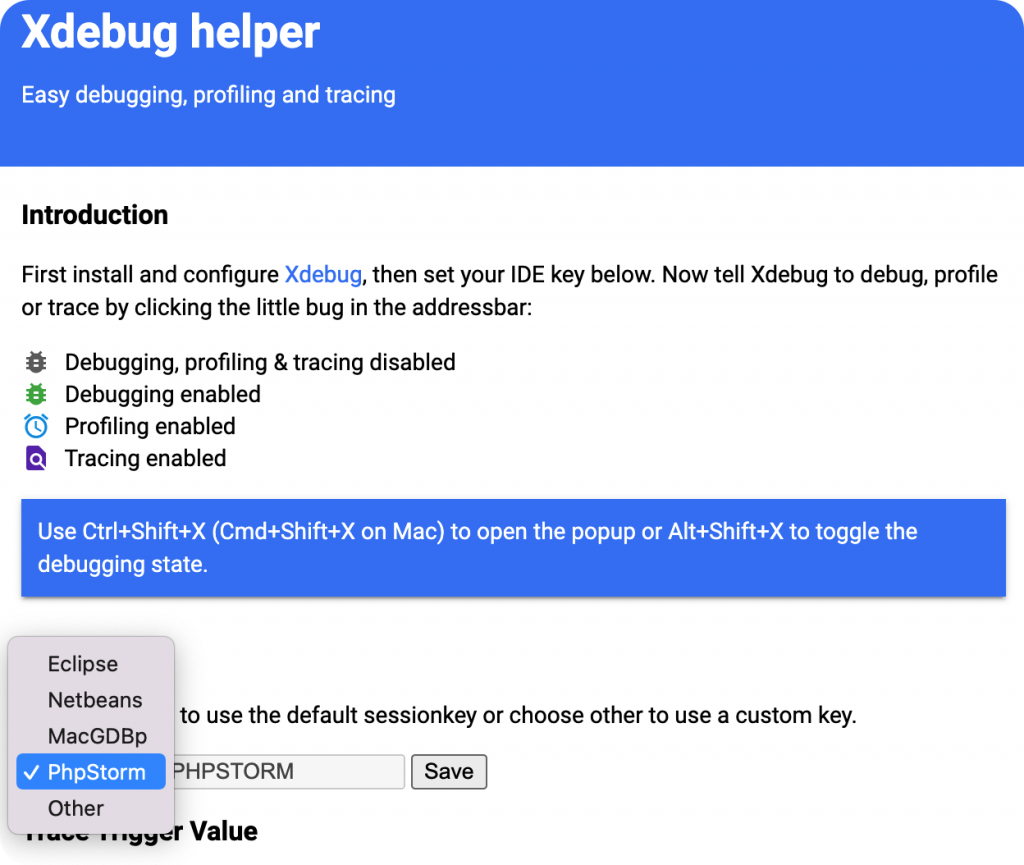
回到网站开启debug即可。
开始debug远程调试
再回到点击右上角的的小电话图标,此时ide会在server端监听9001端口。旧版的Phpstorm是需要在本地ssh远程端口转发来配置的,现在ide已经自动实现了。
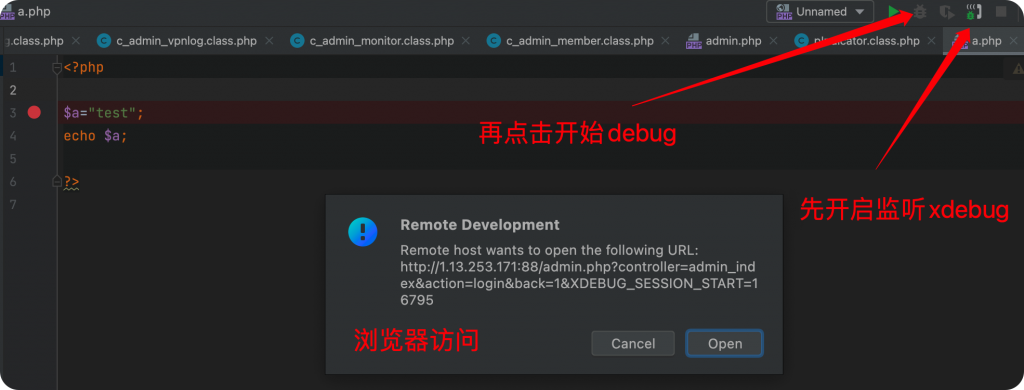
浏览器访问该页面ide就会自动断在这里。
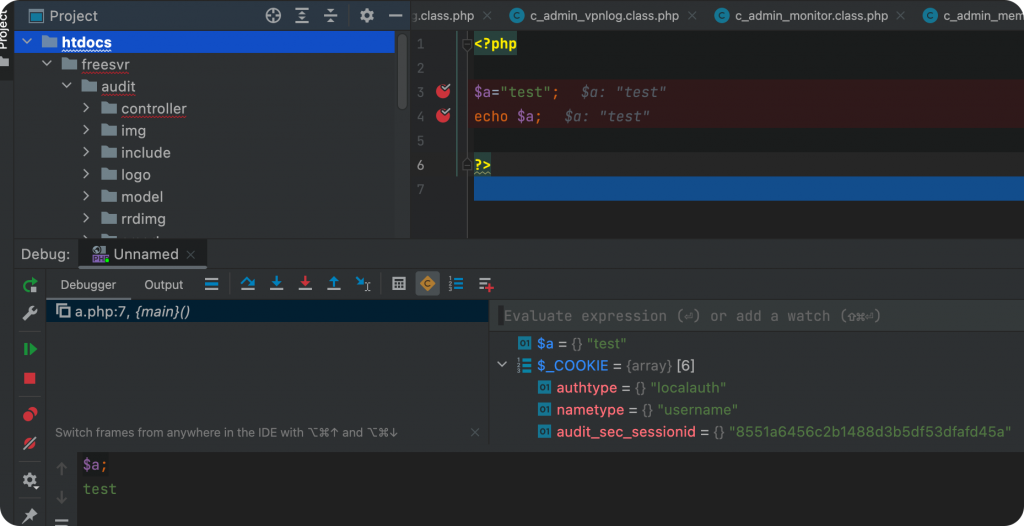
就可以开始代码审计了。
赞赏 微信赞赏
微信赞赏 支付宝赞赏
支付宝赞赏
目前为止有一条评论